Advanced Reporting &
Analytics Platform
Stop flying blind. Interlink builds custom, real-time dashboards by connecting your Interlink Cloud PBX data directly to Grafana — tailored to your exact KPIs, not generic templates.
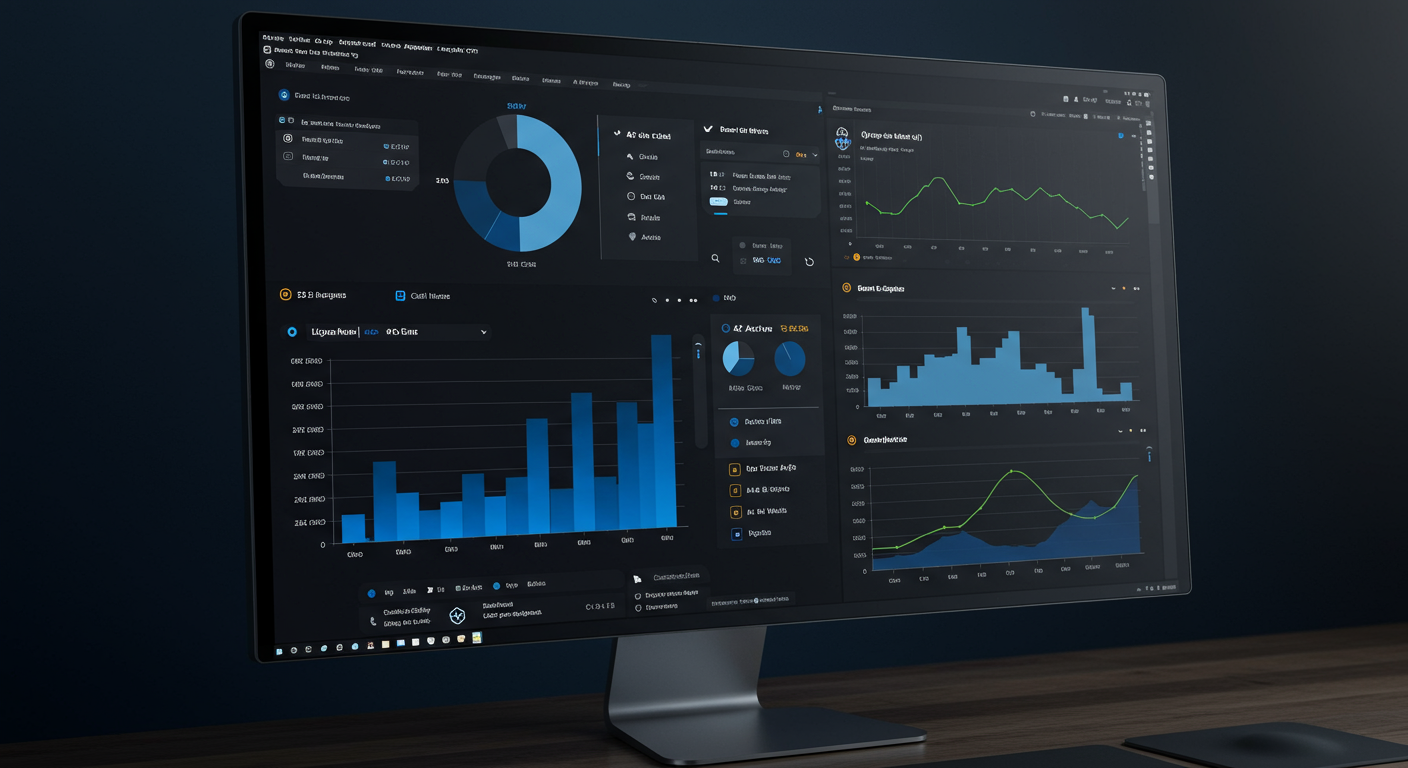
How Interlink + Grafana Work Together
Interlink bridges your phone system's raw data with Grafana's visualization engine to create dashboards that are genuinely useful — not just pretty.
Your Phone System as the Data Source
Interlink logs every call, queue event, agent status change, and extension activity into its CDR database in real time. This includes timestamps, durations, caller IDs, queue positions, wait times, transfer chains, and recording references — all structured and queryable.
Interlink's Data Pipeline
Our team configures secure, read-only API and database connections from your phone system to your dedicated Grafana instance. We write the queries, configure the refresh intervals (as fast as 5 seconds for live wallboards), and handle all the data transformation.
Grafana Visualizes Everything
Grafana renders your phone system data as time-series charts, heatmaps, leaderboard tables, stat panels, and geomaps. Dashboards auto-refresh, support drill-down filtering by agent or queue, and trigger SMS or email alerts when any metric crosses a threshold you define.
What You Can Measure
Click any metric below to see exactly what data Interlink captures and how Grafana surfaces it for your team.
Call Volume Trends
PBX CDR + Grafana Time-SeriesVisualize inbound, outbound, and internal call volumes across any time range — by hour, day, week, or month.
Interlink connects your Interlink Call Detail Records (CDR) directly to Grafana time-series panels, giving you a continuous view of call traffic across your entire organization. You can drill down to a specific DID, department, or agent — or zoom out to see monthly trends for executive reviews.
Data Available in This Report
- Inbound vs. outbound vs. internal call breakdown
- Hourly, daily, weekly, and monthly volume charts
- Per-DID and per-department traffic analysis
- Day-over-day and week-over-week comparisons
- Automatic anomaly highlighting when volume spikes or drops
Get Better Business Insights
Your call data contains answers to your biggest operational questions. Interlink's analytics platform surfaces them automatically.
Call Pattern Intelligence
Understand exactly when your customers call, which channels they prefer, and how demand shifts throughout the day, week, and season — so you're always staffed at the right level.
- Hourly and daily volume heatmaps
- Seasonal trend forecasting
- Channel breakdown by inbound vs. outbound
Agent Efficiency Insights
Move beyond headcount and see which agents handle the most calls, deliver the fastest resolutions, and drive the highest satisfaction — then replicate that performance across your team.
- Per-agent answer rates and handle times
- Idle vs. active time breakdown
- Leaderboards to motivate and benchmark
Customer Experience Analytics
Track the full caller journey from first ring to resolution. Identify where customers drop off, what drives callbacks, and which queues create the most friction.
- First-call resolution rates by department
- Abandonment analysis by time of day
- Repeat caller identification and trends
Cost & ROI Optimization
See the true cost of every call, identify underutilized lines, and make a data-backed case for the right team size — eliminating waste and maximizing your communications budget.
- Per-call cost analysis and benchmarks
- Line utilization reports for rightsizing
- ROI comparisons vs. previous phone systems
How We Build Your Dashboard
From kickoff to live reporting in days, not months. Our team handles everything end to end.
Discovery & KPI Mapping
We start by learning what matters to your business — call volume goals, SLA targets, agent metrics, and executive reporting needs. No generic templates; every dashboard starts with your actual KPIs.
Custom Dashboard Build
Our analytics team builds your Grafana dashboards from scratch, pulling live data from your phone system and configuring panels, alerts, and filters to match your exact operational structure.
Live, Ongoing & Evolving
Your dashboard goes live and updates in real time. As your business changes, we iterate — adding new metrics, adjusting views, and building new report types whenever your needs evolve.
Set it and forget it.
Need to brief the executive team every Monday? Our automated reporting engine generates beautiful PDF summaries and emails them directly to your stakeholders on your schedule.
- Daily Shift Summaries
- Weekly Performance Reviews
- Monthly Executive Briefings
- Custom Alert Thresholds (SMS/Email)
Ready to see your data come to life?
Schedule a live demo and we'll show you exactly what your reporting dashboard could look like — built around your KPIs.